Get Up To $1,500 Paid Back in Bonus Bets
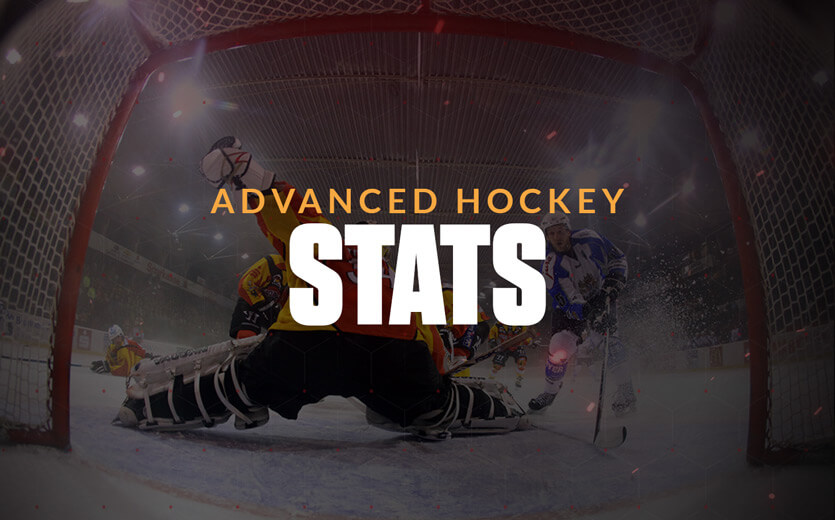
Advanced Hockey Stats for Bettors: Corsi vs Fenwick & Beyond
Updated:
Advanced hockey stats can give you a major edge when betting on the NHL. Welcome to the world of analytics, where there’s no shortage of ways to slice and dice both team and individual performances.
 BETMGM SPORTSBOOK
USE CODE SBD1500 TO GET UP TO $1,500 PAID BACK IN BONUS BETS
 BET365 SPORTSBOOK
BET $10 & GET $150 IN BONUS BETS
 THESCORE BET SPORTSBOOK
USE CODE DIME TO GET 100% BET RESET UP TO $1,000
 DRAFTKINGS SPORTSBOOK
BET $5, GET $150 IN BONUS BETS WITHIN 14 DAYS
 FANDUEL SPORTSBOOK
BET $5 & GET UP TO $1,000 IN BET RESET TOKENS!
 CAESARS SPORTSBOOK
USE CODE SBDDYW & DOUBLE YOUR WINNINGS ON YOUR FIRST 10 WAGERS!
 FANATICS SPORTSBOOK
USE CODE DIMEFAN & GET $10 x $100 BET MATCHES IN FANCASH!
DRAFTKINGS T&Cs: GAMBLING PROBLEM? CALL 1-800-GAMBLER or 1-800-MY-RESET, (800) 327-5050 or visit gamblinghelplinema.org (MA). Please Gamble Responsibly. 888-789-7777/visit ccpg.org (CT), or visit www.mdgamblinghelp.org (MD), 1-800-981-0023 (PR). 21+ and present in most states. (18+ DC/NH/PR/WY). Void in CAN. Eligibility restrictions apply. On behalf of Boot Hill Casino (KS). Pass-thru of per wager tax may apply in IL. 1 per new DraftKings customer. $5+ first-time bet req. Max. $150 issued as non-withdrawable Bonus Bets that expire in 7 days after issuance. Stake removed from payout. Reward issued as $50 in Bonus Bets every 7 days via click-to-claim for 14 days. 7 days = 168hrs. Terms: sportsbook.draftkings.com/promos. Ends 8/23/26 at 11:59 PM ET. Sponsored by DK.
BET365 SPORTSBOOK T&Cs: GAMBLING PROBLEM? CALL 1-800-GAMBLER or 1-800-MY-RESET (AZ, CO, IL, IN, KS, KY, LA, MD, MI, MO, NC, NJ, OH, PA, TN, VA) or 1-800-BETS OFF (IA). 21+ only (18+ in KY). Please gamble responsibly. Must be present in AZ/CO/IA/IL/IN/KS/KY/LA (select parishes)/MD/MI/MO/NC/NJ/OH/PA/TN/VA. Minimum $10 deposit required. Minimum odds -500 of greater. Bonus Bets wager excluded from returns. New customers only. T&CS, time limits and exclusions apply.
BETMGM T&Cs: Gambling problem? Call 1-800-GAMBLER or 1-800-MY-RESET (Available in the US), 877-8-HOPENY or text HOPENY (467369) (NY), 1-800-327-5050 (MA), 1-800-BETS-OFF (IA), 1-800-981-0023 (PR). 21+ only. Please Gamble Responsibly. See BetMGM.com for Terms. First Bet Offer for new customers only (if applicable). Subject to eligibility requirements. Bonus bets are non-withdrawable. In partnership with Kansas Crossing Casino and Hotel. Promotional offers not available in MS, NY, NV, ON, or PR.
Every team in the league has a department focused on analytics. These number crunchers try to gain every edge when it comes to player development and team scouting, and you should be looking at the same numbers when handicapping your hockey bets. Let’s take a look at the statistics worth paying attention to when preparing for your next hockey wager.
Corsi vs Fenwick – Which Advanced Stat Should You Use?
Possession is key in the NHL. Keeping control of the puck results in more scoring chances and keeps the opposition away from your end of the ice. With this simple reality in mind, two different stats have become popular with hockey experts to determine how each player contributes to possession, or how much control a team has over the progression of the game.
CAESARS SPORTSBOOK
Bet $1 & Double Your Winnings on Your Next 10 Wagers!
LOCK IN PROMO
CODE: SBDDYW
CODE: SBDDYW
You’ll hear hockey commentators debating the merits of Corsi vs Fenwick, but at minimum, understand that they both provide an estimation of either an individual player’s overall contribution to the team’s success (individual Corsi/Fenwick) or each team’s relative control of the puck and gameplay (team Corsi/Fenwick).
Corsi
Corsi measures the total number of shots at the net for/against at even strength. Team Corsi refers to this value for the entire team throughout the season, while individual Corsi measures these values while the player in question is on the ice. In both cases, the value can be expressed as a differential (+/-) or as a percentage (for or against). A positive corsi value or ‘for’ percentage greater than 50% indicates that player or team spends more time in the opposing zone than in their own. Most players will range between 40-60%, with elite players settling at 55% or higher and below average players at 45% or less.
Fenwick
Fenwick is a variation of Corsi that eliminates one element that we consider very important – blocked shots. While Corsi accounts for any attempt put on goal, Fenwick does not include blocked shots for or against. The idea here is that players or teams don’t deserve any credit for having a shot blocked and don’t deserve to be penalized if they are able to block a shot.
Assuming you believe that total scoring chances are paramount in deciding which team could have an edge, most experts lean towards using Corsi. The logic here is that all attempts at the net indicate control of the puck and dominance of gameplay, even if the shots are ultimately blocked by a strong defensive play.
Individual Stats vs Team Stats – Which Are More Valuable?
Possession numbers were originally introduced as a way of evaluating individual players beyond looking at goals, assists, points and plus/minus. While team Corsi or Fenwick can indicate a squad’s fundamental ability to find success as a team, the numbers generally provide more value when looking at the abilities of individual players. Consider researching a team’s line combinations to see if a particular trio of players is having success together. If you notice a defensive pairing on the opposing team is struggling, you could have a potential mismatch worth exploiting.
An example of an elite line is the Boston Bruins top unit. Brad Marchand, Patrice Bergeron and David Pastrnak all have FF% (Fenwick For %) over 60%.
Key Individual Stats to Analyze
In addition to Corsi and Fenwick, here is a list of five key advanced hockey stats to help you evaluate the abilities of an individual player:
PTS/60
Points per 60 minutes. This stat helps to normalize players and shows production on a level playing field. Top forwards often play upwards of 20 minutes per game and the best defenseman can play more than 25 minutes. If a team is shuffling its lines because of injury and giving more minutes to a player that was previously lower in the lineup, PTS/60 is a great stat to predict their likely efficiency.
E +/-
Expected plus minus is a great stat that considers the quality of scoring chances each player generates when on offense and allows when on defense. Simple things like line changes or a powerplay ending right before a goal sometimes skew a players true +/-, so this expected +/- gives a better representation of what you can expect when that player is on the ice. Compare E +/- with actual +/- to identify players who are exceeding or failing to meet their expected production – a discrepancy here suggest they may be on a hot or cold streak worth paying attention to.
SAtt
Shot attempts in all situations. While Corsi and Fenwick deal exclusively with even strength play, SAtt takes all shot attempts into consideration. Of course, goals are scored outside of even strength play. It makes sense to consider a great power play unit that could swing the balance of a game. It can be tough to predict exactly how many power plays a team will get, but if you see a match up against an opponent that tends to accumulate penalties, you’ll want to do a deep dive into this stat.
Thru%
Percentage of shots taken that go on net. While generating chances is important, making good on them is also valuable. This helps identify the players who tend to follow through when presented with a chance to score.
Zone Starts
Percentage of time a player starts a shift in the offensive zone and the defensive zone. Like PTS/60 this stat is valuable when there is a change in the lineup and a player is about to earn more ice time with an offensive unit. If you find a player who produced well with a high percentage of defensive zone starts, it would stand to reason he will produce in a more offensive role.
PDO Is the Most Valuable Team Stat
PDO tracks team shooting percentage + team save percentage, and it can be a valuable addition to Corsi and/or Fenwick when handicapping team strength. PDO is valuable because it essentially values production at both ends of the ice.
If a team scores or stops the puck at an elite level they will have a high PDO. If they do both you’ll almost surely see them atop the standings.
This stat is also available for individual players – well-rounded players like Auston Matthews have led the league in the past – but it’s most helpful when looking at the team as a whole. If the teams you’re comparing have a wide gap in team PDO, it could be a green light to make a confident wager.
BETMGM SPORTSBOOK
Gambling problem? Call 1-800-GAMBLER or 1-800-MY-RESET (Available in the US), 877-8-HOPENY or text HOPENY (467369) (NY), 1-800-327-5050 (MA), 1-800-BETS-OFF (IA), 1-800-981-0023 (PR). 21+ only. Please Gamble Responsibly. See BetMGM.com for Terms. First Bet Offer for new customers only (if applicable). Subject to eligibility requirements. Bonus bets are non-withdrawable. In partnership with Kansas Crossing Casino and Hotel. Promotional offers not available in MS, NY, NV, ON, or PR.
LOCK IN PROMO
CODE: SBD1500
CODE: SBD1500
The Importance of Goaltending
NHL goalies may be the most important individual players in any sport. Always do your research to confirm the goalie you’re betting on is capable of keeping your team in the game. Start with obvious stats like wins, goals against average and save percentage. Here are three more advanced hockey stats that can help you identify the netminders most worthy of your action.
GSAA
Goals saved above average helps to equalize goalies regardless of the team they play for. While such a player-centric stat may seem most useful for a General Manager looking to acquire a new goalie, it’s a reliable nightly indicator for hockey bettors as well. GSAA shows how much a team relies on their goalie to win games. In 2019, Andrei Vasilevskiy won the Vezina Trophy as the league’s best goalie, posting a 26.40 GSAA.
QS
Quality starts. This popular baseball stat is typically used to evaluate pitchers, but it comes in handy when evaluating the consistency of NHL goaltenders as well. To earn a quality start, a goalie must post a save percentage better than the league average for the year, or a save percentage better than .885% on a night when they face 20 shots or less. A goalie who racks up quality starts won’t necessarily guarantee a win, but it’s highly unlikely they’ll be the one to lose it with a weak performance.
GA%
Goals allowed percentage relative to the league average. The lower the number, the better the performance a goalie has had throughout the season. When researching this stat, 100 is exactly average.
Monitor Stats Both Old School & New
Diving into analytics doesn’t mean you should throw the old metrics in the garbage. Tracking which teams have the best power plays and penalty kills is still important, as is keeping a look at trends like winning and losing streaks. Couple those old school stats with the more advanced analytics outlined in this article to take full advantage of valuable data this hockey season.
Of course, you can also track every NHL team’s performance on the betting line by visiting SBD Sharp, the tool that tracks return on investment for bettors throughout the season. For a comprehensive run-down of the considerations you need to make when betting on hockey, check out the NHL articles in our sport-specific betting advice section.
As always, please wager responsibly, and enjoy the action this season.

Patrick Cwiklinski
Evergreen Manager; Sportsbook Expert
Following a sports journalism career with his work appearing in outlets like theScore, The Province, and VICE Sports, Patrick moved into the world of content marketing to bridge the gap between great writing and SEO success. He’s brought that same mindset to lead evergreen content efforts at SBD.
NFL
NBA
NHL
NCAAF
MMA
Sportsbooks
Gambling