What Are NET Rankings? Understanding College Basketball’s Ranking System
Updated:
Verified by: Patrick Cwiklinski
The NET Ranking is a major tool used in the creation of the March Madness bracket.
But what is it? The NCAA Evaluation Tool is the main metric used by the NCAA Selection Committee for sorting teams and seed both the men’s and women’s NCAA Tournaments. It replaced RPI in 2018, and uses two main factors, Team Value Index (TVI) and Adjusted Net Efficiency, to rank the nearly 400 NCAA teams eligible for tournament play.
NET Rankings Explained
NET Rankings divide college basketball teams into four quadrants (“Quad 1” being the best and “Quad 4” being the worst) based on the strength of their wins and losses which are determined by the game location and level of opponent.
The NCAA Evaluation Tool is a ranking system for men’s and women’s college basketball teams, developed in partnership with the NCAA and Google Cloud.
The NET uses a highly sophisticated algorithm the NCAA doesn’t share. However, NET rankings are adjusted daily during the college basketball season and displayed publicly on NCAA.com and NCAA.org.
It is one of the sorting tools used by the selection committees to determine which teams receive at-large bids for March Madness. We wish we could say that NET rankings alone determined tournament seeding, but it’s not that simple.
Remember, teams that win their conference tournaments automatically qualify for the NCAA tournament. The remaining tournament bids are given to teams who the selection committee considers the best in the country. Many of them will have high NET rankings, but that isn’t a perfect predictor of a team making the tournament, nor is it necessarily an indication of how teams will be seeded. There will be teams left out with good NET rankings and others that squeak in with relatively poor rankings.
NET Rankings vs. RPI
Prior to adopting the NET ranking system, the NCAA had utilized the Rating Percentage Index, or RPI, since 1981.
Widely criticized for not accounting for a teams’ margin of victory, the RPI was calculated based on winning percentage, strength of schedule, and opponents’ strength of schedule. In theory, RPI punished teams for playing weaker opponents, which isn’t entirely in the realm of control for teams in weaker conferences.
As an attempt to overcome the shortfalls of the RPI, the NET considers multiple other factors. We’ll share as much info as we can about each of these in the next sections.
How Are NET Rankings Calculated?
The NCAA does not publicly share the exact formula it uses to calculate NET rankings. In fact, there is almost no part of the NET that can be calculated or reverse engineered. The proprietary algorithm is a tightly kept secret, but here’s what we do know: the NET has two main components – adjusted net efficiency and the team value index.
The NCAA dropped three other components of the original NET formula before the 2020-2021 college basketball season. The new NET algorithm no longer uses winning percentage, adjusted winning percentage, and scoring margin. The NCAA confirmed it does not anticipate any further adjustments in the formula for several years.
Let’s explore the remaining factors in as much detail as possible with the limited information provided.
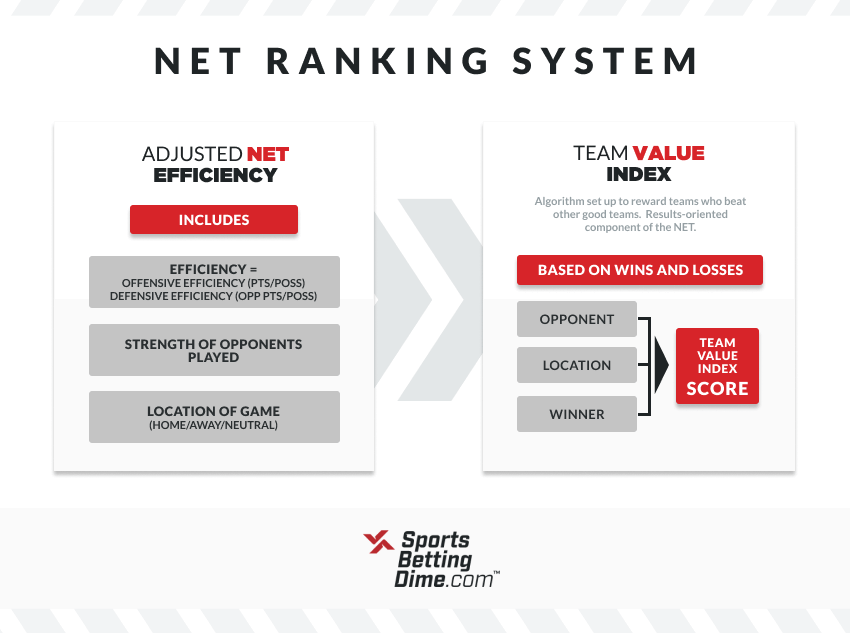
Adjusted Net Efficiency
In basketball, net efficiency is a team’s offensive efficiency (points per possession) minus its defensive efficiency (opponent points per possession). Here’s the basic formula:

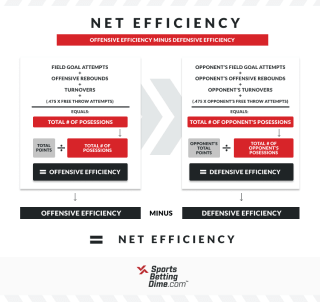
To find adjusted net efficiency, the NCAA tweaks the above calculation to account for strength of opponent and game location – home, away, or neutral– across all games played.
Exactly how the algorithm calculates this adjustment is somewhat of a mystery. The important thing to remember is that a given net efficiency value – say, 8.2 points per 100 possessions – rates higher against stronger competition than the same efficiency against weaker opponents. Equally, having a certain efficiency when playing on the road rates higher than accomplishing that same efficiency at home.
Adjusted net efficiency is now the most heavily weighted part of the NET formula, so running up the score can have a significant effect on NET rankings.
Team Value Index
The Team Value Index (TVI) is the other “results-oriented” element of the NET. It’s designed to reward teams for beating other good teams.
The Team Value Index only considers games against Division I opponents and is based on results. The algorithm factors in the opponent, location, and winner to produce a TVI score. Again, little information is shared about how TVI is actually calculated.
Interestingly, strength of schedule is in some way part of both adjusted net efficiency and the Team Value Index, but its exact impact on each component is – you guessed it – a secret.
What About the Quadrant System?
Hoops diehards are probably wondering if the so-called Quadrant System is still in play with NET rankings. The NCAA still utilizes the Quadrant System for March Madness tournament selections and seeding. Essentially, at the end of the regular season, the NET sorts games into tiers, from Quadrant 1 at the top through Quadrant 4.
The men’s and women’s Quadrant Systems differ slightly in how many teams fit into each quadrant.
Here’s a quick overview of the Division I men’s basketball Quadrant System, with the corresponding NET rankings for each quadrant displayed by location:
Here’s how the quadrant system works for the women. The differences are crucial when you’re looking to bet on women’s March Madness.
Quad 1 wins make the biggest headlines, as they come against the highest caliber opponents. On the other end of the spectrum, Quad 4 games are the easiest on the schedule. A loss here could have devastating consequences for a team’s tournament aspirations.
When looking at NCAA rankings, each team’s record will display its overall record, home record, away record, and neutral record, as well as its record in each of the four quadrants. Note that game results can shift between quadrants throughout the season depending on fluctuations of an opponent’s NET ranking.
How to Use NET Rankings to Compare Teams
There are more than 350 schools in Division I men’s college basketball and Division I women’s basketball. Part of what makes March Madness so chaotic is most teams must face opponents from outside of their conferences.
There is simply no perfect way to compare two teams that may not have played each other before or even shared any common opponents in a given season.
That said, NET rankings can provide some valuable insights for basketball bettors as they look through top-rated March Madness betting apps. Because the NET system rewards teams for beating quality opponents and considers adjusted net efficiency, NET rankings should give you some sense of how a team performs against other top competition.
When comparing teams, we recommend looking at the number of Quadrant 1 wins and Quadrant 3 and 4 losses. A team with a good NET ranking but several Quad 3 and 4 losses may be prone to playing down to their opponent. Conversely, a team with a mediocre or even low NET ranking but a few Quad 1 wins may not be the most consistent but could have an upset in them.
Sometimes, a team will have a much lower seeding than their NET ranking would imply, as was the case for New Mexico in the 2024 NCAA men’s tournament. The NCAA doesn’t provide any explanations for this, but an educated guess would be that such teams either played too many Quad 4 games or not enough Quad 1 games, or struggled in their recent performances.
Using NET for Betting on March Madness
While NET is a fine tool for predicting where teams will be in the bracket, it is not a predictive tool like KenPom or Bart Torvik’s T-Rank.
Those tools are using efficiency to rank teams, tracking stats per possession and weighting them based on their opponents, then projecting how they will do in future games. You will notice that the KenPom or T-Rank projections are often incredibly close to the spread.
NET Rankings, however, aren’t always going to line up with how teams are power-ranked by sportsbooks. A team ranked in the top 10 of NET could be listed as a clear underdog against a team outside the top 20. It’s a resume metric, while Vegas rewards efficiency.
A Word of Warning
Bracketology is complicated, as much an art as a science. Exactly how the NCAA utilizes its own evaluation tools and team sheets is convoluted and vague, perhaps even intentionally so.
The NET is a complex analytical model, but it’s still just one part of the picture. Tournament seedings are not solely decided based on NET ranking.
In 2024, the top three teams in the NET rankings (Connecticut, Houston and Purdue) all received a No. 1 seed from the men’s basketball committee. On the women’s side, only two of the top four squads in the NET rankings received a No. 1 seed – South Carolina and Texas. One of the top seeds, USC, was ranked No. 10 in NET Ranking!
While the NET is a useful predictive metric, we must remind bettors that no single metric can perfectly foresee every outcome – that’s why we have to play the games.
Similarly, despite spending millions on developing algorithms, the March Madness selection committee is ultimately still a human committee, and thus a flawed one. For all its high talk of “amateurism” when discussing its athletes, the NCAA is still run like a business. March Madness brings in over a billion dollars of revenue every year, and one has to wonder what impact that has on tournament selection.
NET Rankings FAQs
No. The NET Ranking is a metric based on Net Efficiency and Team Value Index. The AP Poll is a weekly ranking that is determined by votes of sports writers selected by the Associated Press.
Are you a Miami (OH) fan? Kidding. But NET is based on a team’s resume, which is based on the TVI and Net Efficiency. It rewards teams for wins against highly-ranked teams, as well as wins away from home.
No. NET does not consider margin of victory in its rankings. While scoring margins can get baked into some of the metrics used to create NET rankings, it is not a direct tool used for NET.
Your Source for College Basketball Betting Information
Even with sophisticated ranking systems in play, college basketball can still be unpredictable. That’s all part of the fun.
Be sure to check out our “How to Bet on Sports” section for more NCAA basketball betting advice. We provide all the information you need to make confident wagers and fill out your March Madness brackets. You’ll also want to claim the best March Madness betting promos before tip-off.
Have fun and enjoy the action out there!

Evergreen Writer/Editor; Sportsbook Expert
With nearly two decades of experience in sports media, Paul Costanzo turned his professional attention to sports betting and online gambling in January of 2022. He's covered every angle of the industry since then, managing and creating content for PlayMichigan and The Sporting News, and now SBD.