Updated 2020 MLB Win Totals After 60-Game Regular Season Officially Set
By Sascha Paruk in MLB Baseball
Updated: March 9, 2021 at 3:41 pm ESTPublished:

- The 2020 MLB regular season will consist of 60 games for each team
- Sportsbooks have posted new win totals based on a truncated season
- The over/unders range from 38.5 (.642 win percentage) to just 21.5 (.358 win percentage)
After months of negotiations failed to produce a return-to-play agreement, MLB Commissioner Rob Manfred used a power granted to him in a previous March accord to unilaterally set the length of the 2020 season.
Manfred implemented a 60-game regular season to be followed by the usual 10-team playoff.
Sportsbooks, which had converted the 2020 MLB win totals to win percentages while the length of the season was unsettled, have re-tabulated the standard win totals for a 60-game calendar.
Below, find the new win totals in alphabetical order followed by highest to lowest. Each win total is juxtaposed with the 60-game win projections from FanGraphs. After the tables, I discuss a couple over/unders that stand out based on recent MLB history.
MLB 60-Game Win Totals: Alphabetical
| Team | Win Total O/U | 2020 Projected Wins (FanGraphs) |
|---|---|---|
| Arizona Diamondbacks | 31.5 (-115o/-115u) | 29.8 |
| Atlanta Braves | 33.5 (-115o/-115u) | 32.3 |
| Baltimore Orioles | 21.5 (-115o/-115u) | 22.4 |
| Boston Red Sox | 31.5 (-115o/-115u) | 31.4 |
| Chicago Cubs | 31.5 (-130o/+100u) | 31.6 |
| Chicago White Sox | 31.5 (-110o/-120u) | 30.6 |
| Cincinnati Reds | 31.5 (-115o/-115u) | 30.7 |
| Cleveland Indians | 32.5 (-115o/-115u) | 31.6 |
| Colorado Rockies | 27.5 (-110o/-120u) | 28.4 |
| Detroit Tigers | 21.5 (-115o/-115u) | 24.8 |
| Houston Astros | 35.5 (-115o/-115u) | 35.3 |
| Kansas City Royals | 24.5 (-115o/-115u) | 26.3 |
| Los Angeles Angels | 31.5 (-125o/-105u) | 30.6 |
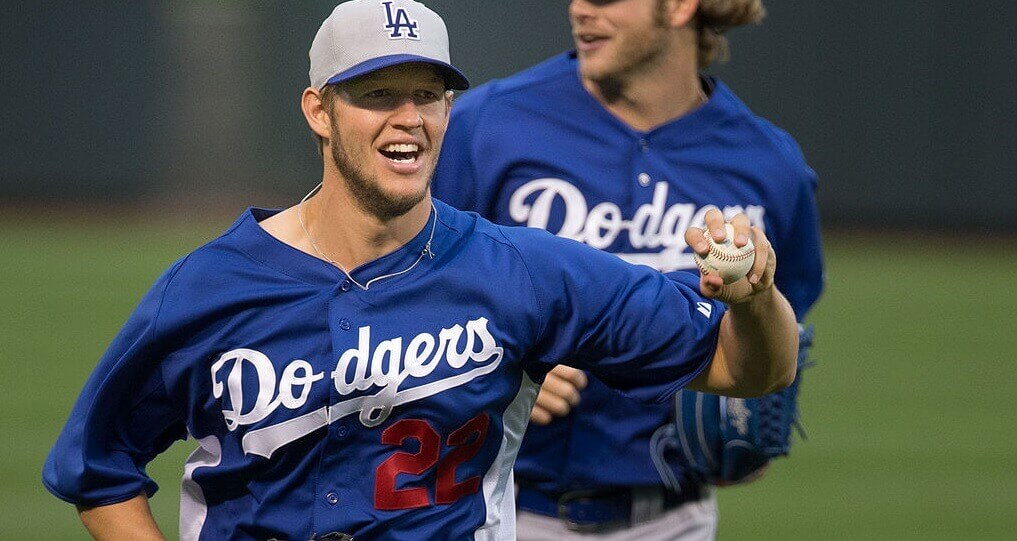
| Los Angeles Dodgers | 38.5 (-115o/-115u) | 35.8 |
| Miami Marlins | 24.5 (-115o/-115u) | 25.7 |
| Milwaukee Brewers | 31.5 (-115o/-115u) | 30.6 |
| Minnesota Twins | 34.5 (-105o/-125u) | 32.8 |
| New York Mets | 32.5 (-120o/-110u) | 31.6 |
| New York Yankees | 38.5 (-115o/-115u) | 34.7 |
| Oakland Athletics | 33.5 (-120o/-110u) | 31.6 |
| Philadelphia Phillies | 31.5 (-115o/-115u) | 29.9 |
| Pittsburgh Pirates | 25.5 (-115o/-115u) | 25.6 |
| San Diego Padres | 31.5 (-115o/-115u) | 31.1 |
| San Francisco Giants | 25.5 (-115o/-115u) | 25.3 |
| Seattle Mariners | 25.5 (-115o/-115u) | 24.4 |
| St. Louis Cardinals | 32.5 (-115o/-115u) | 30.2 |
| Tampa Bay Rays | 33.5 (-115o/-115u) | 33.2 |
| Texas Rangers | 29.5 (-115o/-115u) | 29.0 |
| Toronto Blue Jays | 28.5 (-115o/-115u) | 27.6 |
| Washington Nationals | 33.5 (-115o/-115u) | 32.5 |
Win totals as of June 24, 2020.
MLB 60-Game Win Totals: Highest to Lowest
| Team | Win Total O/U | 2020 Projected Wins (FanGraphs) |
|---|---|---|
| Los Angeles Dodgers | 38.5 (-115o/-115u) | 35.8 |
| New York Yankees | 38.5 (-115o/-115u) | 34.7 |
| Houston Astros | 35.5 (-115o/-115u) | 35.3 |
| Minnesota Twins | 34.5 (-105o/-125u) | 32.8 |
| Atlanta Braves | 33.5 (-115o/-115u) | 32.3 |
| Oakland Athletics | 33.5 (-120o/-110u) | 31.6 |
| Tampa Bay Rays | 33.5 (-115o/-115u) | 33.2 |
| Washington Nationals | 33.5 (-115o/-115u) | 32.5 |
| Cleveland Indians | 32.5 (-115o/-115u) | 31.6 |
| New York Mets | 32.5 (-120o/-110u) | 31.6 |
| St. Louis Cardinals | 32.5 (-115o/-115u) | 30.2 |
| Arizona Diamondbacks | 31.5 (-115o/-115u) | 29.8 |
| Boston Red Sox | 31.5 (-115o/-115u) | 31.4 |
| Chicago Cubs | 31.5 (-130o/+100u) | 31.6 |
| Chicago White Sox | 31.5 (-110o/-120u) | 30.6 |
| Cincinnati Reds | 31.5 (-115o/-115u) | 30.7 |
| Los Angeles Angels | 31.5 (-125o/-105u) | 30.6 |
| Milwaukee Brewers | 31.5 (-115o/-115u) | 30.6 |
| Philadelphia Phillies | 31.5 (-115o/-115u) | 29.9 |
| San Diego Padres | 31.5 (-115o/-115u) | 31.1 |
| Texas Rangers | 29.5 (-115o/-115u) | 29.0 |
| Toronto Blue Jays | 28.5 (-115o/-115u) | 27.6 |
| Colorado Rockies | 27.5 (-110o/-120u) | 28.4 |
| Pittsburgh Pirates | 25.5 (-115o/-115u) | 25.6 |
| San Francisco Giants | 25.5 (-115o/-115u) | 25.3 |
| Seattle Mariners | 25.5 (-115o/-115u) | 24.4 |
| Kansas City Royals | 24.5 (-115o/-115u) | 26.3 |
| Miami Marlins | 24.5 (-115o/-115u) | 25.7 |
| Baltimore Orioles | 21.5 (-115o/-115u) | 22.4 |
| Detroit Tigers | 21.5 (-115o/-115u) | 24.8 |
Win Totals That Stand Out Immediately
The NY Yankees and LA Dodgers both have win totals of 38.5. Hitting the over (39 wins) would require a win percentage of .650. In a 162-game season, they would have to win 106 games to hit the over.
I am not going to focus on roster construction, free-agent acquisitions, or the potential for injury. I am going to focus on the recent history of teams winning 65% of their games. It’s not common.
Over the past two years, three teams have finished with at least 106 wins: the 2018 Boston Red Sox (108), the 2019 Houston Astros (107), and the 2019 Dodgers (106). But from 2002 to 2017, zero teams – not a single one – finished with a .650 win percentage.
History shows how hard it is to win 65% of games against major-league competition. Adding in the FanGraphs projections (34.7 wins for the Yankees, 35.8 wins for the Dodgers), the under on both powerhouses looks extremely tempting.
At the other end of the spectrum lie the Detroit Tigers and Baltimore Orioles, both at 21.5 wins. A 21-39 record would amount to a win percentage of .350.
The 2019 Orioles went 54-108 (.333 pct) while the 2019 Tigers finished dead-last in the majors at 47-114 (.292 pct), a full seven wins worse than 29th-place Baltimore.
The history of teams finishing seasons with win percentages lower than .350 is more prevalent than teams finishing over .650. Over the past three seasons, three teams have accomplished the feat: the Orioles in 2018 and 1029, and the Tigers in 2019.
How bad is the Detroit Tigers offense this year?
The 2003 Detroit Tigers (AL Record 119 losses) averaged 3.6 runs per game.
The 2019 Detroit Tigers currently average 3.49 runs per game.
— Justin Spiro (@DarkoStateNews) June 16, 2019
From 2001 to 2017, another eight teams earned the dubious distinction: the Astros from 2011 to 2013, the Kansas City Royals in 2005, the Arizona Diamondbacks in 2004, the Tigers in 2003 and 2002 and the Tampa Bay (Devil) Rays in 2002.
It’s those Astros and Tigers teams that would give me pause when considering the over on the 2020 Orioles and Tigers. It is easier for excellent teams to fall off a little next season than it is for truly terrible teams to dig themselves out of talent-deficient holes.

Managing Editor
Sascha has been working in the sports-betting industry since 2014, and quickly paired his strong writing skills with a burgeoning knowledge of probability and statistics. He holds an undergraduate degree in linguistics and a Juris Doctor from the University of British Columbia.


