Learn How to Read Baseball Stats
Updated:

Learning how to read baseball stats is an easy way get more enjoyment out of the game, especially if you’re wagering on the results.
The numbers displayed across the scoreboard only scratch the surface of the world of baseball stats. There are literally hundreds of different metrics recorded at every game that can help you with your baseball betting strategy.
 BETMGM SPORTSBOOK
USE CODE SBD1500 TO GET UP TO $1,500 PAID BACK IN BONUS BETS
 BET365 SPORTSBOOK
BET $10 & GET $150 IN BONUS BETS
 THESCORE BET SPORTSBOOK
USE CODE DIME TO GET 100% BET RESET UP TO $1,000
 DRAFTKINGS SPORTSBOOK
BET $5, GET $150 IN BONUS BETS WITHIN 14 DAYS
 FANDUEL SPORTSBOOK
BET $5 & GET UP TO $1,000 IN BET RESET TOKENS!
 CAESARS SPORTSBOOK
USE CODE SBDDYW & DOUBLE YOUR WINNINGS ON YOUR FIRST 10 WAGERS!
 FANATICS SPORTSBOOK
USE CODE DIMEFAN & GET $10 x $100 BET MATCHES IN FANCASH!
DRAFTKINGS T&Cs: GAMBLING PROBLEM? CALL 1-800-GAMBLER or 1-800-MY-RESET, (800) 327-5050 or visit gamblinghelplinema.org (MA). Please Gamble Responsibly. 888-789-7777/visit ccpg.org (CT), or visit www.mdgamblinghelp.org (MD), 1-800-981-0023 (PR). 21+ and present in most states. (18+ DC/NH/PR/WY). Void in CAN. Eligibility restrictions apply. On behalf of Boot Hill Casino (KS). Pass-thru of per wager tax may apply in IL. 1 per new DraftKings customer. $5+ first-time bet req. Max. $150 issued as non-withdrawable Bonus Bets that expire in 7 days after issuance. Stake removed from payout. Reward issued as $50 in Bonus Bets every 7 days via click-to-claim for 14 days. 7 days = 168hrs. Terms: sportsbook.draftkings.com/promos. Ends 8/23/26 at 11:59 PM ET. Sponsored by DK.
BET365 SPORTSBOOK T&Cs: GAMBLING PROBLEM? CALL 1-800-GAMBLER or 1-800-MY-RESET (AZ, CO, IL, IN, KS, KY, LA, MD, MI, MO, NC, NJ, OH, PA, TN, VA) or 1-800-BETS OFF (IA). 21+ only (18+ in KY). Please gamble responsibly. Must be present in AZ/CO/IA/IL/IN/KS/KY/LA (select parishes)/MD/MI/MO/NC/NJ/OH/PA/TN/VA. Minimum $10 deposit required. Minimum odds -500 of greater. Bonus Bets wager excluded from returns. New customers only. T&CS, time limits and exclusions apply.
BETMGM T&Cs: Gambling problem? Call 1-800-GAMBLER or 1-800-MY-RESET (Available in the US), 877-8-HOPENY or text HOPENY (467369) (NY), 1-800-327-5050 (MA), 1-800-BETS-OFF (IA), 1-800-981-0023 (PR). 21+ only. Please Gamble Responsibly. See BetMGM.com for Terms. First Bet Offer for new customers only (if applicable). Subject to eligibility requirements. Bonus bets are non-withdrawable. In partnership with Kansas Crossing Casino and Hotel. Promotional offers not available in MS, NY, NV, ON, or PR.
With even the smallest elements of the game quantified, it pays to know what you’re looking at. This simple guide will tell you exactly how to read baseball stats and which ones are most useful to evaluate batting, pitching, and fielding performance.
If you’re looking for detailed definitions of every baseball stat, check out our comprehensive baseball stat abbreviation glossary.
Jump to:
- Learn How to Read Baseball Stats
- Traditional Baseball Stats vs. Sabermetrics
- Understanding Key Betting Stats
- How to Read Pitching Stats
- Analyzing Crucial Defensive Stats
- One Stat to Rule Them All: WAR
Learn How to Read Baseball Stats
Have you ever struggled to figure out where the score is when watching a Major League Baseball game? You wouldn’t be alone…
Baseball’s unique scoreboard is packed with additional information that provides context about the game in addition to the current score.
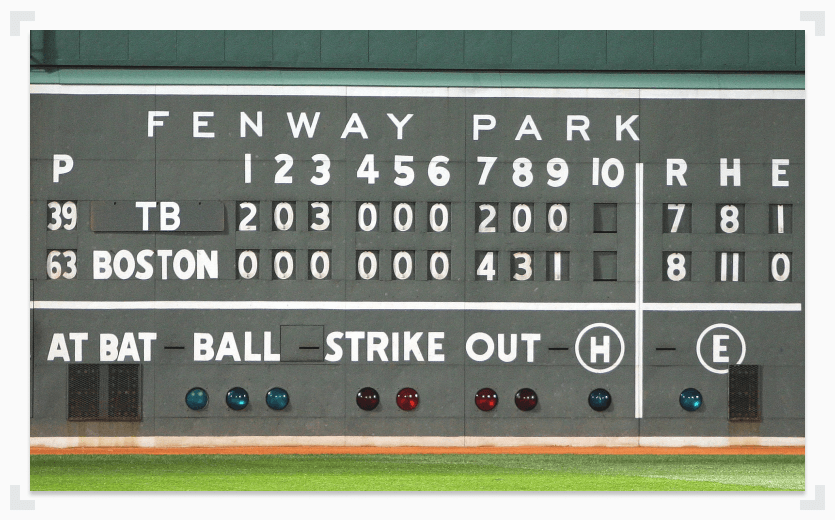
When looking at a classic baseball scoreboard, you’ll see each team listed on the far left. The away team will always be listed on top, with the home team listed on the bottom (because the home team always bats second).
Moving from left to right, you’ll see at least nine columns labelled numerically. Each represents one inning of the game.
The numbers below indicate how many runs each team scored during that inning. The final column is sometimes labeled ‘EI’ and is used to tally any runs scored during extra innings.
Following the inning score boxes, you’ll see three columns labelled R, H, and E. These columns indicate each team’s tallies in the following categories.
R – Total Number of Runs Scored
H – Total Humber of Hits
E – Total Number of Errors
Focus on the column labeled ‘R’ if you’re simply looking for the score.
The number of balls and strikes thrown during the current at bat are also displayed. Pitching statistics sometimes also appear on the master scoreboard, such as the total number of pitches thrown or innings pitched.
Even a quick glance at the scoreboard reveals a substantial amount of detail about the progression of the game. But if you want to harness the full potential of statistics to improve your understanding of baseball, you’ll need to look beyond the edges of the ballpark.
The internet is a great place to start.
Traditional Baseball Stats vs. Sabermetrics
Baseball might be America’s pastime, but arguing about the validity of different stats is the baseball fan’s pastime. Understanding the different types of stats will go a long way in handicapping MLB odds on your favorite ballclub.
Traditional stats focus on tallying the achievements and failures of players throughout the game, with little consideration for their larger context. This makes them useful when comparing very specific elements of a team or player’s performance, but their value is extremely limited when it comes to high-level comparisons of overall quality.
Sabermetrics, on the other hand, use incredibly complex mathematical formulas to account for these shortcomings. These detailed analyses are valuable indicators of overall quality and player/team potential, but they run the risk of being overly abstract and attempting to quantify elements of the game better left to qualitative observation.
Understanding Key Batting Stats
Ultimately, success in baseball is about the final score. No team can come out on top without a few talented batters and baserunners able to put the ball in play and make their way around the bases.
Most Popular Batting Stats
Batting Average (AVG)
Batting Averages are probably the most widely discussed stat in all of baseball. Abbreviated AVG on the scoreboard or box score, batting average describes the percentage of the time a player has successfully hit the base and reached a base when batting during the current season.
Batting Average is a broad statistic and doesn’t tell us any additional information about either the quality of each hit or the number of times a batter advanced to first after being walked or hit by a pitch. As such, it’s best used as very general indicator of a player’s ability to hit the ball.
Today, the stat is mostly used as a litmus test of basic ability. Major League players are expected to bat at least .200, while .300 is considered hot and .400 is considered on fire.
On-Base Percentage (OBP)
On-Base Percentage, or OBP, expands on batting average to also record instances in which the batter advances to first as the result of a walk or hit-by-pitch. OBP is the overall average percentage of the time a batter reaches base after stepping up to bat.
Because it is inclusive of all scenarios in which a hitter advances, OBP is a more useful indicator of offensive productivity than batting average. That said, it still fails to weight the relative value of each advancement (hitting a triple has the same effect on OBP as being walked to first base).
Runs Batted In (RBI)
Runs Batted In, or RBI, measures the number of runs scored as a direct result of a batter hitting the ball or being walked while at bat. Traditionally, high RBI numbers have been associated with successful ‘clean-up’ batters able to bring baserunners home for a score. 100 is considered a strong number for the season.
However, RBI is a crude statistic that doesn’t correlate directly to a player’s ability to hit in clutch situations. Your ability to drive in runs is clearly dependent on the ability of the batters who hit before you. If they often get on and advance through the bases, you’re at a major advantage in terms of RBI potential.
To accurately evaluate clutch hitting ability, you need to compare batters’ ability to drive in runs when presented an opportunity to do so. Look at weighted runs created in the section below.
Most Useful Batting Stats
Weighted On-Base Average (wOBA)
It’s fair to think of Weighted On-Base Average, or wOBA, as a more helpful version of OBP. wOBA is a catch-all sabermetric stat that attributes a relative value to each hit or advancement to first base. The formula to calculate wOBA is complex, but trust that it’s the product of years of refinement.
By weighting offensive events based on their value rather than treating them all equally, wOBA does a better job of identifying which hitters are contributing the most to their team’s ability to put points on the scoreboard.
Weighted Runs Created Plus (wRC+)
Like wOBA, Weighted Runs Created Plus is a weighted sabermetric stat that evaluates a player’s overall offensive contributions. wRC+ is expressed as the number of runs a player is worth to their team relative to the league average.
All players are weighted around a value of 100 as the league average. This means that a player with a wRC+ value of 150 created 50% more runs than an average player would when presented with the exact same game conditions.
Isolated Power (ISO)
Isolated Power, or ISO, can be used to quickly identify those batters with the most raw power. ISO indicates the percentage of time a batter hits a double, triple, or home run.
Note that ISO is a descriptive stat – it tells you what type of hitter a player is rather than directly indicating their offensive value.
How to Read Pitching Stats
Before getting into reading specific pitching stats, you need to decide if you’re looking at starting pitchers or relief pitchers. Starting pitchers are expected to throw more than relief pitchers, and you can categorize relievers as “long” and “short” pitchers. Long relief pitchers might be expected to cover multiple innings, while short relievers might come in for only a couple of outs.
This might not have a huge impact on how you read pitching stats, but it can change how you handicap your wagers. You’ll want to know the most important pitching stats to get a better understanding of how to read them before placing your bets in hopes of some easy baseball profits.
Most Popular Pitching Stats
Earned Run Average (ERA)
ERA is the most widely referenced pitching statistic. It roughly assesses how many runs a pitcher has allowed per nine innings pitched.
Compared to more recently-developed comprehensive pitching stats (like FIP), ERA fails to account for a number of poor defensive plays resulting in runs. Pitchers who play on teams with weak defenses are heavily disadvantaged by this metric.
Strikeouts (K)
Often displayed as ‘K’ on ballpark scoreboards, a simple tally of the number of batters a pitcher has thrown out is a rudimentary stat that provides very little context about a pitcher’s overall value.
Within an individual game, it can be useful in determining how many outs can be attributed directly to the efforts of the pitcher currently on the mound.
Innings Pitched (IP)
Innings Pitched, or IP, is most useful in evaluating the likely depth of a starting pitcher. If you know a starter’s average IP per game, you can roughly predict when they are likely to be relieved by the bullpen.
Note that each out that occurs while a pitcher is on the mound counts as 1/3 of an inning pitched. Pitchers are attributed an inning for every three outs during which they are in the game.
Most Useful Pitching Stats
Strikeout Percentage (K%)
As a rate rather than tally statistic, Strikeout Percentage, or K%, is a more useful way to evaluate a pitcher’s likelihood to strike batters out rather than walk them or give up hits. The beauty of rate statistics is that they are simple to calculate and understand
Compare a pitcher’s strikeout percentage with their walk percentage to easily get a sense of their overall quality. The more a pitcher’s strikeout rate exceeds their walk rate, the more effective a pitcher is likely to be.
Fielding Independent Pitching (FIP)
This stat does not fault the pitcher for negative outcomes that involve fielding or luck, providing an ERA alternate that focuses only on factors exclusively within a pitcher’s control. It is intended as a direct replacement for ERA, meaning you can use it to directly compare the relative value of two or more pitchers.
While some pitchers may consistently outperform their FIP rating, it’s generally a far more accurate predictor of future pitching performance than traditional ERA.
Skill-Interactive Earned Run Average (SIERA)
Skill-Interactive ERA, or SIERA, is very similar to FIP and also allows you to directly compare the overall quality of two or more pitchers. It’s a very complex and advanced sabermetric stat that uses additional inputs to avoid the pitfalls of traditional ERA while still considering a pitcher’s responsibility for balls that are put into play.
If you’re going to look at only one pitching stat, SIERA is the most comprehensive and accurate.
SIERA uses math to put strikeout rates, walk rates, and the type of hits that most often occur while a pitcher is on the mound into the proper context.
If you’re going to look at only one pitching stat, this one is the most comprehensive and accurate.
If you’re interested in learning more about this powerful number, check out this of primer article.
Analyzing Crucial Defensive Stats
Most Popular Defensive Stats
Errors (E)
Errors are one of the key stats to appear on virtually every ballpark scoreboard (check the ‘E’ column for a team’s total during the game).
Errors are attributed when a player fails to make a defensive play that an average player would have made. Clearly, players with lots of errors make lots of mistakes. That’s not a good thing.
But remember that like other tallying stats, errors alone don’t consider the rate at which these mistakes are made relative to a fielder’s overall defensive opportunities. This is a key factor when considering that shortstops or third basemen, for instance, encounter far more fielding opportunities than players in other positions.
Fielding Percentage (FPCT)
Fielding Percentage, or FPCT, DOES account for the number of opportunities a fielder is given to either make or break a play. As a rate statistic, it’s far more valuable than looking at errors alone. The number you see is the percentage of the time a player successfully fields the ball when given the chance.
FPCT does not account for the relative difficulty of fielding opportunities. Shortstops and third basemen remain disadvantaged by the fact that they typically encounter far more challenging fielding opportunities than other position players.
Outs (O)
Clearly, players who record a lot of outs contribute positively to their team’s defensive success. That said, this stat doesn’t provide enough context to get a real sense of a player’s defensive value.
Most Useful Defensive Stats
Assists (A)
Rather than looking solely at outs, consider how many assists a position player has recorded. Often times, the player who initially fields the ball and throws it to the relevant base deserves the most credit for the resulting out or double play.
Defensive Runs Saved (DRS)
Defensive Runs Saved, or DRS, uses an advanced formula to capture all of a player’s defensive contributions and indicate how many runs they ‘save’ relative to an average player at the same position.
Remember that an average player will have a DRS rating of 0, while the best fielders will have DRS scores above 15.
Ultimate Zone Rating (UZR)
Ultimate Zone Rating is extremely similar to DRS. Both stats are displayed on the same scale and serve as comprehensive indicators of fielding ability relative to an average player of the same position.
Note that both metrics are not weighted based on playing time.
One Stat to Rule Them All: WAR
Wins Above Replacement, or WAR, is an incredibly complex but incredibly helpful statistic that can be used to compare the value of players in all positions. We like it so much we put together an entire guide on how to use WAR to make smarter baseball bets.
Knowing the WAR of players on your team is important when you’re looking at MLB division odds or even the World Series odds.
Use These Stats to Start Betting on Baseball
Now that you know how to read the most important baseball stats, it’s time to get started with your online MLB baseball betting journey.
- BETMGM SPORTSBOOK
USE CODE SBD1500 TO GET UP TO $1,500 PAID BACK IN BONUS BETS
- BET365 SPORTSBOOK
BET $10 & GET $150 IN BONUS BETS
- THESCORE BET SPORTSBOOK
USE CODE DIME TO GET 100% BET RESET UP TO $1,000
- DRAFTKINGS SPORTSBOOK
BET $5, GET $150 IN BONUS BETS WITHIN 14 DAYS
- FANDUEL SPORTSBOOK
BET $5 & GET UP TO $1,000 IN BET RESET TOKENS!
- CAESARS SPORTSBOOK
USE CODE SBDDYW & DOUBLE YOUR WINNINGS ON YOUR FIRST 10 WAGERS!
- FANATICS SPORTSBOOK
USE CODE DIMEFAN & GET $10 x $100 BET MATCHES IN FANCASH!
DRAFTKINGS T&Cs: GAMBLING PROBLEM? CALL 1-800-GAMBLER or 1-800-MY-RESET, (800) 327-5050 or visit gamblinghelplinema.org (MA). Please Gamble Responsibly. 888-789-7777/visit ccpg.org (CT), or visit www.mdgamblinghelp.org (MD), 1-800-981-0023 (PR). 21+ and present in most states. (18+ DC/NH/PR/WY). Void in CAN. Eligibility restrictions apply. On behalf of Boot Hill Casino (KS). Pass-thru of per wager tax may apply in IL. 1 per new DraftKings customer. $5+ first-time bet req. Max. $150 issued as non-withdrawable Bonus Bets that expire in 7 days after issuance. Stake removed from payout. Reward issued as $50 in Bonus Bets every 7 days via click-to-claim for 14 days. 7 days = 168hrs. Terms: sportsbook.draftkings.com/promos. Ends 8/23/26 at 11:59 PM ET. Sponsored by DK.
BET365 SPORTSBOOK T&Cs: GAMBLING PROBLEM? CALL 1-800-GAMBLER or 1-800-MY-RESET (AZ, CO, IL, IN, KS, KY, LA, MD, MI, MO, NC, NJ, OH, PA, TN, VA) or 1-800-BETS OFF (IA). 21+ only (18+ in KY). Please gamble responsibly. Must be present in AZ/CO/IA/IL/IN/KS/KY/LA (select parishes)/MD/MI/MO/NC/NJ/OH/PA/TN/VA. Minimum $10 deposit required. Minimum odds -500 of greater. Bonus Bets wager excluded from returns. New customers only. T&CS, time limits and exclusions apply.
BETMGM T&Cs: Gambling problem? Call 1-800-GAMBLER or 1-800-MY-RESET (Available in the US), 877-8-HOPENY or text HOPENY (467369) (NY), 1-800-327-5050 (MA), 1-800-BETS-OFF (IA), 1-800-981-0023 (PR). 21+ only. Please Gamble Responsibly. See BetMGM.com for Terms. First Bet Offer for new customers only (if applicable). Subject to eligibility requirements. Bonus bets are non-withdrawable. In partnership with Kansas Crossing Casino and Hotel. Promotional offers not available in MS, NY, NV, ON, or PR.
Check out the rest of the baseball articles in our how to bet on sports section for more MLB-specific betting advice, and best of luck out there!

Evergreen Manager; Sportsbook Expert
Following a sports journalism career with his work appearing in outlets like theScore, The Province, and VICE Sports, Patrick moved into the world of content marketing to bridge the gap between great writing and SEO success. He’s brought that same mindset to lead evergreen content efforts at SBD.